Introduction
The goal of this project was to use stock technical indicators along with data analysis to determine optimal times to buy or sell stocks. To begin the project, I coded several technical indicators and made sure they were running correctly before using them for analysis.
The technologies used in this project.
- Pandas
- Numpy
- Seaborn
- Matplotlib
- Seaborn
- Yfinance
- Date Time
To begin this project, I started with one of the simplest technical indicators. The simple moving average. I started by importing all of the libraries as well as the Yahoo Finance Stock API yfinance. I chose Apple as the stock to analyze. I started the data out in January of 2010. The moving average for a given time period was simply calculated by df.close.rolling(window = *time period*).mean() as shown below. Then each of these moving averages were added on to the original dataset df. Each of the averages and the close price were plotted using matplotlib.

Below is the output of the graph will the moving averages and closes.
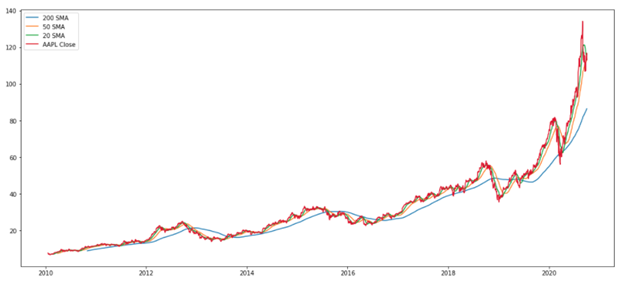
Looking at the end of the data frame, I compared the most recent moving averages to the most recent moving averages on Marketwatch.com and found that they were in 0.001% of each other. This proves that the moving averages I calculated were spot on.
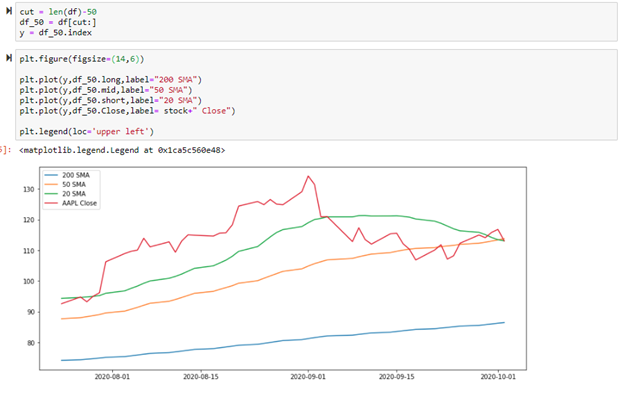
A popular analysis method with moving averages is the Golden Cross and the Death Cross. The Golden Cross occurs when a short-term moving average moves above a long-term moving average (indicating a buy signal). The Death Cross occurs when a short-term moving average moves below a long term moving average (indicating a sell signal).
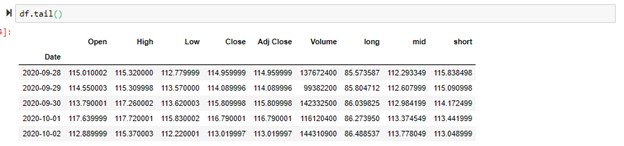
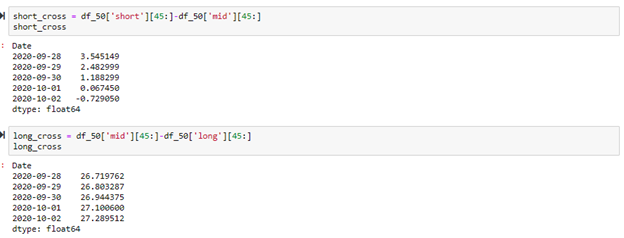
In the code below, I slice the original data frame to have a close up look at the last 50 days of trading for this stock.
The code below, shows a slice of the most recent 5 days of trading. The short cross slice shows the differences between the 20 day SMA and the 50 day SMA. The long cross slice shows the differences between to 200 day SMA and the 50 day SMA. Whenever these numbers in this list switch from positive to negative, or vice versa, it shows that a cross over has been made. Positive numbers in this list indicate the shorter moving average is above the longer moving average. Negative numbers in this list indicate that the longer moving average is above the shorter moving average. The short cross list is showing a switch from positive to negative from 10/1/2020 to 10/2/2020. This is indicating that a death cross has occurred which would be a signal to sell your stock if you had any shares of Apple. The Golden/Death cross method is all about entry and exit points so tracking the crosses in this method is the most efficient form of analysis.
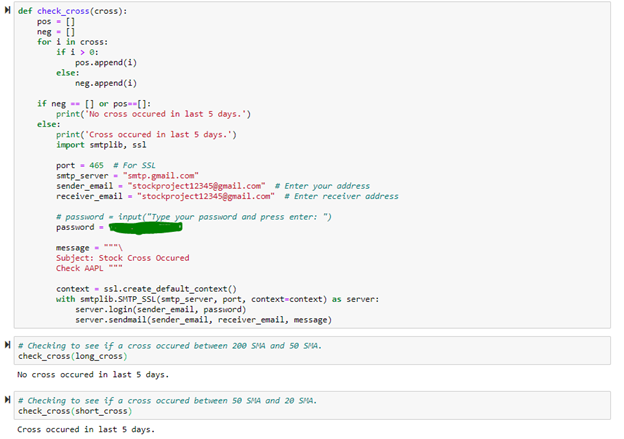
Below is a function for automatically checking if a cross occurred in the last 5 days. This function works by looking at the list of values and determining if there are both positive and negative numbers in the list. If the list only has positive numbers or only has negative numbers, then no cross occurred in the last 5 days. If a cross has occurred, I have created an automatic message that will go to an email address that is specifically for this project. There are many ways this could be further developed. One way would be to transform this file into an executable and use task scheduler to set up an automatic time for this script to run everyday or every 5 days. This would keep track of the stocks without me having to manually run the code myself, and I would receive an email notification when a cross occurs. Another way to make this application better would be to iterate over many individual stocks instead of just one stock.
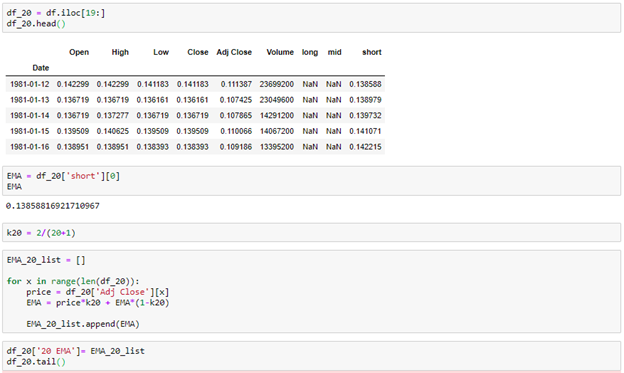
After I finished the simple moving averages, I decided to move on to calculating exponential moving average which is a little more difficult. The exponential moving average is a moving average that puts more weight on more recent closes of the stock. The formula for exponential moving average is shown below.
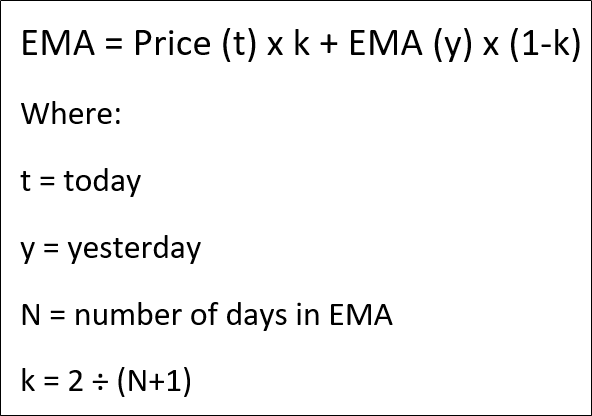
For this calculation, I used the data dating back to when Apple first went public on the stock market. I began by slicing off the first 20 days since they were NaN in the 20 SMA column (short column). The first 20 days do not have a 20 day moving average because 20 days of data is needed to calculate the first point. I proceeded by using the for loop shown below to calculate the 20 day EMA for each date. After the calculations were done, I checked the EMAs with marketwatch.com to confirm they were accurate and stopped the process there.