Introduction
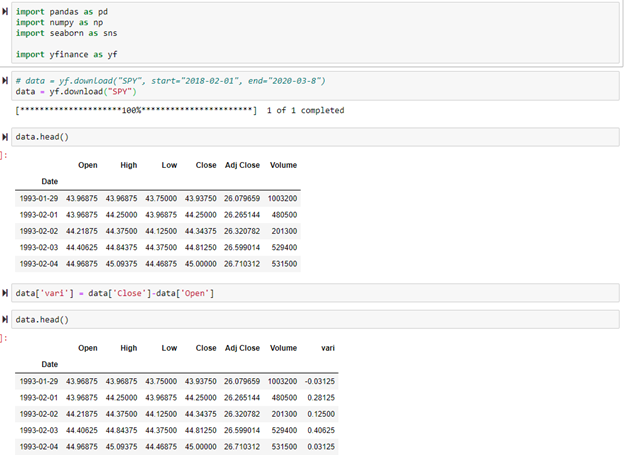
The purpose of this project was to use a logistic regression model to determine whether a stock would go up or down on a given day based on volume, high, and low. The open and close were used to calculate whether the stock went up or down on that day as shown in the vari column below. Since open and close were used to calculate the column that is going to be predicted, the open and close values were not used to perform the predictions. Only volume, high, and low were used to make the predictions.
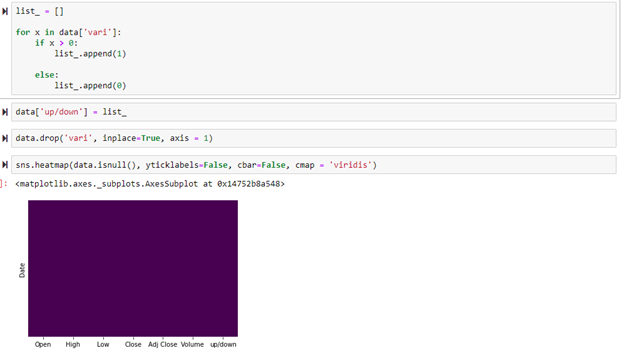
Since this is a classification model, I converted the change from open and close (vari column) to 1 if the stock went up that day and to 0 if the stock went down that day. Then this new transformed data was added onto the dataframe. The heat map was used to determine if any data was missing in the dataframe.
Below shows the data being setup to train and then test.

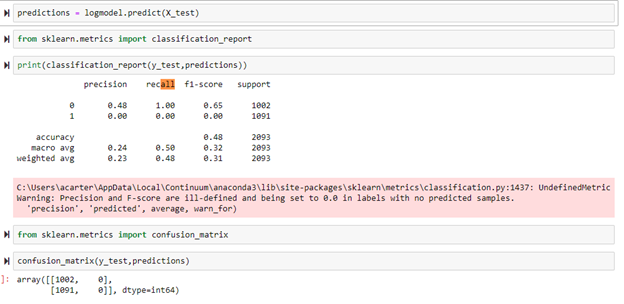
After the model was created, predictions were generated based on the model. The classification report and confusion matrix below show the outcomes of the model. This model performed poorly because it was only 48% accurate. Plus, the model only predicted 0 and the times the stock went up versus the times the stock went up were almost 50% so guessing 0 every time gave it a 50% chance of being correct. This information is not good enough to make investing decisions. A way to make this model better would be to add on a few stock technical indicators to help make more accurate predictions.